
A plantar pressure map is the most quotable image in foot assessment
— and the most quoted out of context. The colours are intuitive, which is exactly why
reports built on pressure measurement travel well in consultations, and exactly why undisciplined
reading spreads: a map that shows concentration under the forefoot gets narrated into conclusions
the recording never made. This article is a practical reading guide — what the recording
contains, how professionals read it in sequence, and the boundaries that keep a pressure map a
measurement rather than a verdict.
FOOTWORK LAB builds pressure assessment hardware, including the X3 foot pressure scanner, at its plant in Ruichang,
Jiangxi Province — producing equipment since 2014, with its own factory since 2018. We watch
thousands of reports leave customers’ screens, and the difference between a service that grows
on this data and one that stalls is rarely the hardware. It is the reading discipline.
The discipline can be taught, and this article is structured as that lesson: what the
recording contains, the order in which professionals read it, the boundaries that keep the
reading inside the evidence, and the habits — in reports, in scheduling, in language — that
make good reading automatic rather than heroic. Buyers evaluating equipment will also find,
threaded through, the questions that reveal whether a supplier’s software supports disciplined
reading or undermines it. The hardware records; the habits decide what the recording
becomes.
A last word on who this discipline belongs to. It is tempting to assign reading quality to
the software, or to the operator, or to the professional — and each owns a share. But the
service owner owns the standard: the capture recipe, the report template, the language rules,
the follow-up schedule. Teams rise or settle to the standard set above them, which is why
reading discipline is ultimately a management decision, made once and enforced quietly every
week afterwards.
What a pressure recording actually contains
Strip the colours away and a pressure recording is a table: force values across the sensing
surface, sampled over time while the person stands or walks. The rendering turns that table
into something a human can read at a glance — regions of higher and lower load, their shape,
their timing. Everything the map shows was in the numbers; everything the numbers show can be
misread once rendered into drama.
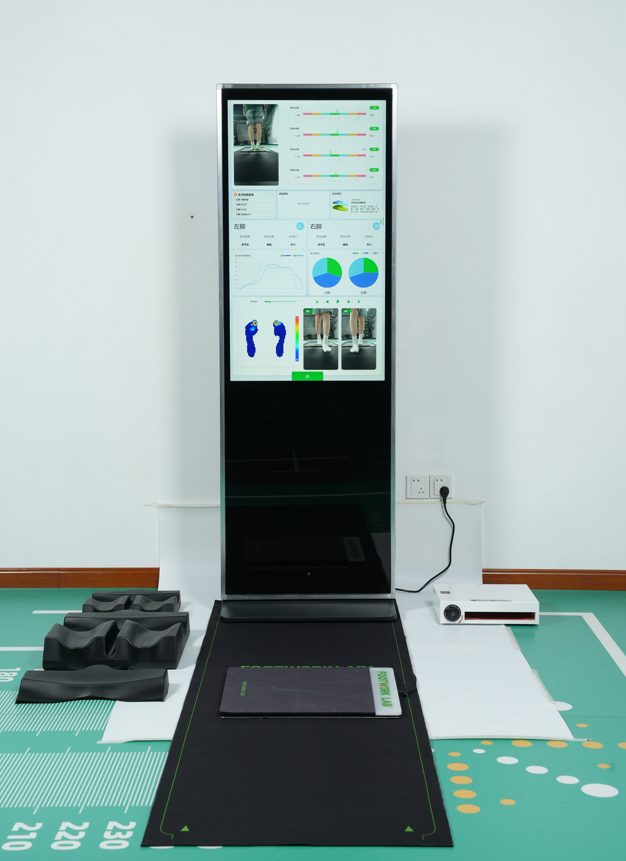
A complete session usually contains three views. The static stance map: load distribution
while standing still. The dynamic passes: how that distribution moves through the step — heel
contact, midfoot loading, forefoot push-off — repeated across several walks. And in combined
systems, the posture and alignment frames captured alongside, which show how the limb positions
itself over the foot while the plate records what happens underneath it.
Buyers evaluating equipment should check that all three views survive into the report. A
report that shows only a single pretty stance map has thrown away the timing, the repetition
and the alignment context — most of what makes the recording worth taking.
A practical exercise for buyers during evaluation: take the same session and render it three
ways — the raw map, the report view, and the exported figures — and check that they agree.
Software sometimes beautifies in rendering: smoothing that softens concentrations, palettes
that dramatise small differences. None of that is dishonest by itself, but a professional
reading a prettified map is reading the renderer’s opinions, not the plate’s signal. Suppliers
who can show raw and rendered side by side are showing you a platform you can trust; suppliers
who cannot are showing you a picture.
Reading order: a sequence that keeps the map honest
Professional readers work in a sequence, and the sequence is what prevents the colourful
free-association that undisciplined reading becomes. Start with conditions: was this static or
dynamic, barefoot or shod, one pass or several consistent ones? A map quoted without its
conditions is a rumour.
Next, whole-foot balance: how load shares across left and right, front and back. Only then
move to regions: what the heel carries, how the midfoot engages, where the forefoot works.
Region-first readers jump to the hottest colour and build a story around it; sequence readers
know a regional concentration can be normal for this person, in these conditions, and the
whole-foot view is what says so.
The whole-foot view also has a communication job that region readings do not: it is where
asymmetries between left and right become discussable without alarm. A person looking at two
maps side by side sees their own balance in a way no verbal description achieves, and the
professional can narrate it descriptively — how the two sides share the work — without drifting
into claims the recording cannot support. Consultations that start at whole-foot level tend to
stay calm and curious; consultations that open on the hottest region tend to produce the
questions professionals then spend the session walking back.
Finish with comparison — across passes within the session, across visits over time. A single
session is a snapshot; the same person re-measured under the same conditions is a trend, and
trends are where this data earns its keep in follow-ups and programme reviews.
The three boundaries that keep the reading professional
Boundary one: the recording describes, it does not conclude. A pressure map shows how load
distributed, for this person, under these conditions. What that means, and any decision about
care, belongs to a qualified professional reading it against history and observation. Equipment
marketing that blurs this line is not bold — it is a liability handed to the buyer.
Boundary two: conditions define the claim. A barefoot map on a flat plate describes barefoot
walking on a flat plate. It does not describe the same person in work boots on a sloped site.
Reports should carry their conditions, and services should re-measure in the conditions that
matter to the question at hand.
Conditions discipline also has an operational form: a written capture recipe. Which footwear
is removed, what the instruction is, how many passes, what the operator confirms before
accepting the session. The recipe turns conditions from a per-operator judgement into a
standard, which is what makes comparisons across operators — and across sites, for groups with
several rooms — legitimate. Buyers comparing systems should ask how easily the software
enforces such a recipe; the answer separates platforms designed for measurement programmes from
platforms designed for demonstrations.
Boundary three: repetition is the evidence. One pass is an anecdote. The professional
question is always whether the pattern repeats — across passes in the session, across visits
in the file. Services that build repeat measurement into their schedule get more value from
the same machine than services that measure once and narrate at length.
Static versus dynamic: two questions, one instrument
The static map answers a standing question; the dynamic passes answer a moving one. Neither
substitutes for the other, and the most common reading error we see is a dynamic conclusion
drawn from a static map — “look how the forefoot loads” — when the forefoot loading in
question only exists in the walking passes.
The reverse error is rarer but real: dismissing the static map as trivial. It is the
baseline against which the dynamic passes read, the view easiest to explain to the person
standing next to the screen, and the most repeatable view in the file. Sessions that skip it
to save two minutes lose the reference point for everything else.
When comparing equipment, verify both views are first-class: that the software guides the
operator through stance and passes with quality checks between, and that the report presents
them together rather than letting the dynamic data drown the static frame.
Between the two views sits a middle capability worth asking suppliers about:
within-session comparison. Software that aligns repeated passes and shows where they agree —
and where one pass differed — turns repetition from a concept into a visible check. Operators
train faster with it, because consistency stops being an instruction and becomes something they
can see. Buyers comparing platforms should rank this feature higher than colour options; it
does more for recording quality per unit of attention than anything else in the
interface.
What the map contributes to an insole specification
For services that produce custom insoles, the pressure recording is the specification
input: where the build must give way, where it must hold, how load should be encouraged to
redistribute. This is also where reading discipline pays commercially — a build specified from
an over-read map inherits the over-reading, and the remake tells on it later.
The specification conversation works best when the professional brings the recording and its
conditions to the factory, not just the hottest screenshot. Our production team reviews the
pressure and posture data, writes the build against it, and — because the assessment hardware
and the production sit under one roof in Ruichang — closes the loop when a remake reveals
something about the reading. Roughly five hundred to a thousand pairs a day pass through that
loop, and each pair is a small experiment in how well the map was read.
That loop deserves one more observation: it runs in both directions. Factories learn from
remakes which specification patterns recur; services learn from factory questions which capture
details matter — weight distribution during stance, pass consistency, footwear conditions. A
service that shares its remake outcomes with its production partner, candidly and with data, is
participating in the same education. The trade’s best supplier relationships are not procurement
arrangements; they are shared feedback loops with invoices attached.
Training a team to read well
Reading discipline is trainable, and the training is cheap relative to the equipment. Give
new operators the sequence — conditions, whole foot, regions, comparison — and make them
narrate reports aloud in that order for their first weeks. Review their narrations; most
over-reading hides in the transition from region to meaning, and it shows up in speech before
it shows up in documents.
Build the boundaries into the report template itself: a conditions line under every map, a
notes field for the professional’s interpretation, and a comparison section when the file
holds more than one session. A template that asks the right questions produces better readers
than a memo about reading carefully ever will.
Template design also shapes tone. A report that asks for the professional’s observations in
a labelled field produces labelled, reviewable observations; a report that leaves a blank box
produces whatever the day produces. The same applies to the comparison section: a structured
before-and-after view invites structured sentences. None of this constrains professional
judgement — it houses it. The best report designs we have seen feel less like forms than like a
well-organised desk: everything where the work expects to find it.
Finally, keep the customer in the loop honestly. The map is a fine conversation tool when
the narrator stays inside its scope: here is how you stand, here is how you walk, here is what
a professional observes across your visits. Customers served that way come back — not because
the colours were dramatic, but because the reading was believable.
And the habit list has one final entry that costs the least and pays the longest: keep the
plain-language version of every report honest. The customer-facing paragraph — what was
recorded, under what conditions, what a professional observed — is where over-reading is most
tempting and most damaging, because it is the sentence the customer repeats. Draft it once,
review it against the boundaries in this article, and reuse the structure. Services that
standardise that paragraph build a reputation for saying exactly what they know, which in this
trade is a competitive advantage that compounds.
Frequently asked questions
Does a pressure map show what is wrong with someone’s feet?
No. It records how load distributed under specific conditions. Interpretation and any
decision about care belong to a qualified professional.
Why do static and dynamic maps differ for the same person?
Because standing and walking are different tasks. Load arrives, transfers and pushes off
dynamically in ways a stance map cannot show, which is why a complete session records
both.
How many walking passes make a reliable recording?
Enough consistent passes that the pattern repeats — several, captured naturally. One pass
is an anecdote; repetition is the evidence.
What equipment records these maps?
A plantar pressure system: a sensing plate for stance and movement, ideally paired with a
camera module for posture and alignment. Our X3 and F2/FMP families are built around that combination.
Can I order a single machine for a small service?
Yes. Our machine minimum order quantity is one unit, so a service can validate its workflow
before scaling.
What warranty and testing stand behind a unit?
Seven days of in-house testing before dispatch, and a twelve-month machine warranty covering
non-human damage with free spare parts in scope.
Which certifications apply to the equipment?
European Union certification and ISO quality system certification — the documentation we
hold, and the exact scope of our claims.
What we would do next
If your service runs on pressure data, start with the reading sequence in this article and
audit your last ten reports against it — the gaps are usually visible in an afternoon. On the
hardware side, the X3 pressure scanner covers the
compact assessment room, the X5 family scales the combined
capture, and the F2/FMP platform is the combined
pressure-and-posture workflow most insole services specify against. The pressure mapping guide goes deeper on the recording itself, and the contact page reaches engineers who read maps for a living. Standing
answers on warranty and logistics live on the FAQ page.
This article is intended for professional and educational reference.
It is not medical advice. Foot assessment equipment produces measurements and images; clinical
interpretation and any decision about care remain the responsibility of a qualified professional.
Certification scope is limited to the documentation we hold: European Union certification and ISO
quality system certification.