
A footprint is the most familiar image in foot assessment and the easiest to over-read. Everyone has seen one. Wet feet on paper, ink pads at school, a colour map on a clinic screen: the picture looks self-explanatory, which is exactly the problem. A print shows where contact occurred. It does not show how much load was carried, how long it stayed, or what the rest of the body was doing.
Pressure measurement adds the missing quantities to the same picture. The outline becomes a field with values, and the field can be compared across visits. But the added data also invites added confidence, and a clinic that presents a colourful print without explaining its limits is inviting a client to read it as a statement about their feet that it cannot support.
We build portable and platform systems that record footprint pressure, including the X1 for mobile work. This article is about reading a static print properly: what the peak positions mean, what the contact area adds, and where the interpretation has to stop.
What a footprint measurement actually is
It is a map of the interface between the sole and a surface, sampled at the moment of capture. Each point reports a value derived from the force carried by the sensing element at that location, normalised over the element’s area. The output is a field, not a photograph.
That distinction matters because a photograph and a field fail differently. A photograph fails by being out of focus; a field fails by being sampled too coarsely for the foot in front of it. A small foot on a coarse grid produces a blocky picture, and the blocks are artefacts rather than anatomy.
The second consequence is that the map describes the interface, not the foot. Soft tissue, footwear and the surface all filter what reaches the sensors. A barefoot recording on a hard platform and a shod recording in a cushioned shoe can differ more than two different feet do.
Third, the map is a snapshot in time. Static standing is not walking, and a standing print describes a distribution that changes constantly during gait. Using a standing print to reason about walking is the most common category error in this branch of assessment.
None of these limits make the measurement less useful. They define what it is for: describing load in stated conditions, with enough precision to compare.
Reading the peak
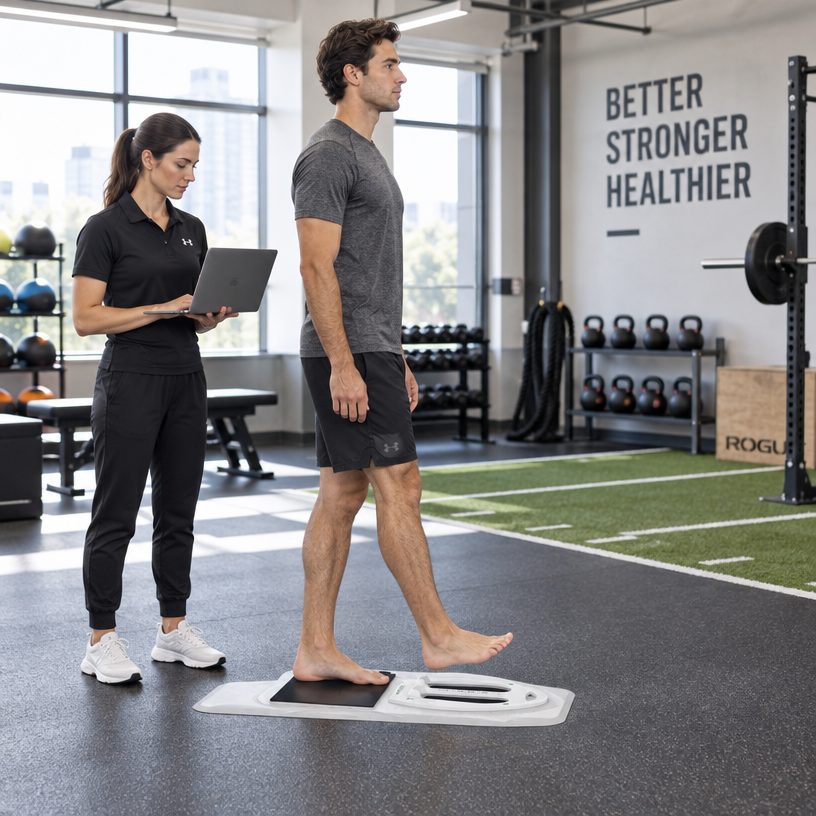
The peak is the point of highest value in the field, and its position is often the first thing a practitioner notices. Position matters more than magnitude in many cases, because a peak that sits where the anatomy expects it is a different story from one that sits at the edge of the contact area.
Beware of a single element. A peak that appears at one sampling point may be a real concentration or an artefact of a small contact patch landing between elements. Look at the shape around the peak, not only at the number.
Compare the two feet. A peak that appears on both sides in similar positions is a pattern; one that appears on one side only is a question. Neither is a finding on its own.
Then compare the peak with the contact time in a dynamic recording. A high value sustained for a long time is a different proposition from a high value that passes in an instant, and static prints cannot distinguish them.
Finally, resist the language of severity. A high number is not automatically a problem, and a low one is not automatically safe. The measurement describes; the professional interprets.
Reading the contact area
Contact area tells you how much of the sole is engaged with the surface. A small area with high values suggests concentration; a large area with low values suggests distribution. Both are descriptions, and both change with the surface and the footwear.
The shape of the area is often more informative than its size. A contact patch that extends medially under the arch describes a foot that is loaded differently from one with a narrow waist, and the difference is visible in the outline before any numbers are read.
Area also exposes an error: if the recording shows a foot that appears to be missing a region entirely, the likely cause is a capture problem rather than anatomy. Check the setup before writing a sentence about it.
Comparing area between visits is useful only if the conditions match. A change of surface, footwear or stance will change the area more than most clinical changes will.
Where a clinic has both feet recorded, compare areas as a ratio rather than as absolute numbers. Ratios survive changes of equipment and calibration better than absolutes do.
Static versus dynamic, again
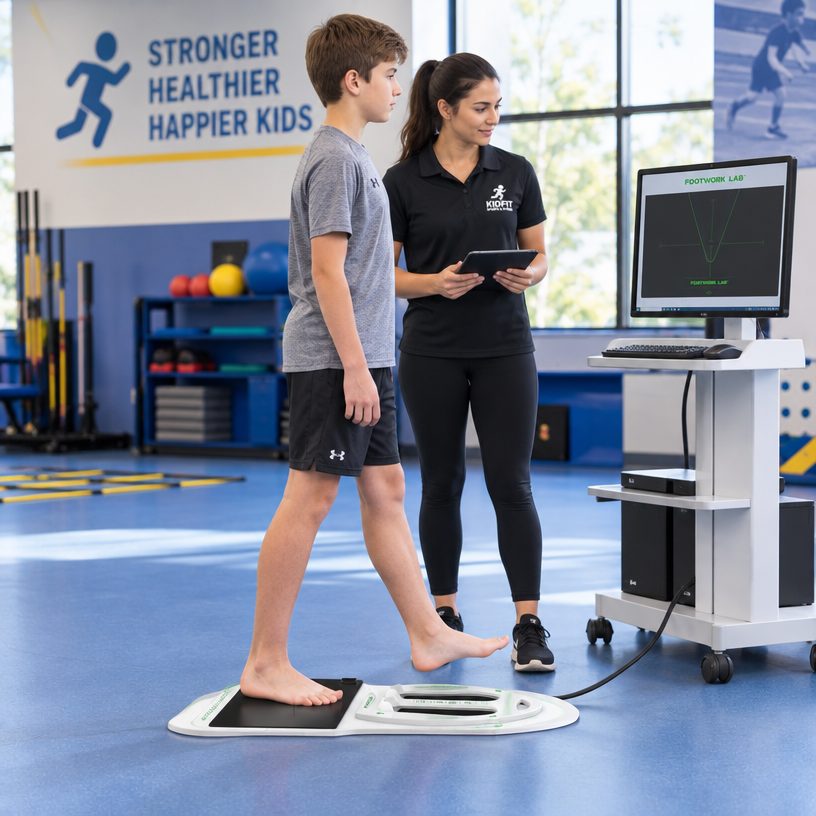
A static print is a single state. It is quick, easy to explain and stable enough to compare. It is also a poor description of walking, because the loads during gait are transient and unevenly distributed in time.
A dynamic recording adds time: contact duration, progression of the centre of pressure, and the sequence in which regions load. Those quantities are what gait questions need, and they are invisible in a static print.
Clinics often use static prints because they are fast, then reason about walking from them. That shortcut produces conclusions the data cannot support, and it is worth stating in the report which recording type was used.
Where both are available, use static for a baseline and dynamic for behaviour. Keep them in separate sections of the report, because they answer different questions.
If only static is available, keep the conclusions static. Describe distribution while standing, and avoid statements about how the person walks.
Common artefacts and how to spot them
The first artefact is partial contact caused by the client not standing fully. A recording taken while someone is still settling shows a lighter, smaller print, and the values are lower across the field.
The second is a foot positioned over the edge of the sensing area. The print appears clipped, and the missing region is often interpreted as unloading.
The third is contamination of the surface. Dust, moisture or a wrinkled covering changes the reading locally, producing a spot that looks anatomical and is not.
The fourth is calibration drift. A surface that has not been checked produces values that are internally consistent across the field and wrong in absolute terms, which is undetectable without a reference check.
All four are prevented by routine rather than by technology: a settling period, a position check, a clean surface and a periodic load check. A clinic that does those four things will have fewer mysteries than one that invests in a better sensor and skips the routine.
Reporting a footprint measurement
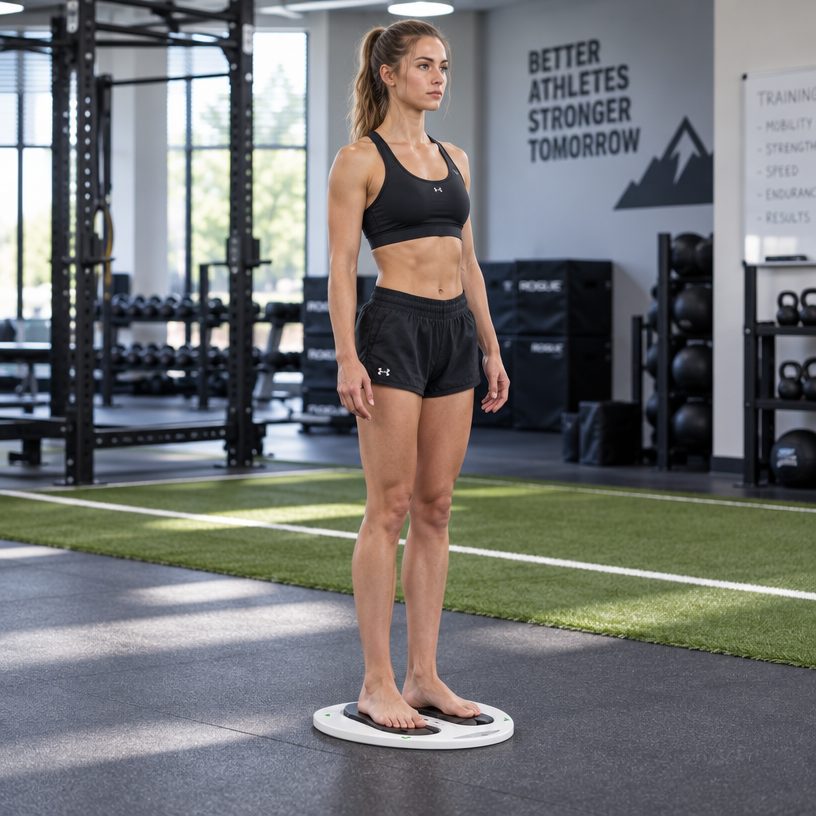
Report the conditions first: static or dynamic, barefoot or shod, which surface, which system. Without those, the numbers cannot be compared with anything, including the clinic’s own earlier recordings.
Report the values without adjectives. Peak, area, and the left-right difference are enough for most purposes, and each is a number a reader can check.
Then report observations in separate sentences, and interpretation separately again, signed. This is the same discipline as any assessment report, and it matters more here because the image is persuasive.
Include the image. A report without the map is a set of numbers that the client cannot connect to their own foot, and the map is the part they will remember.
State what the recording does not show. One sentence is enough: it describes distribution in these conditions, and it does not establish cause or predict outcome.
Where a print is genuinely useful in a commercial setting
In a retail or fitting setting, a print is a conversation tool. It gives the customer something to look at, and it turns a technical recommendation into a shared observation. That is legitimate, as long as the language stays descriptive.
In a production setting, a print is a specification input. It tells the person building the device where load concentrates, which informs contour height and posting decisions. It does not replace the assessment, but it is a useful summary to send with an order.
In a screening setting, a print is a triage tool. It helps decide who needs a longer appointment, which is a workflow decision rather than a clinical one.
In a follow-up setting, a print is a comparison. Two prints with matching conditions show whether something changed, and that is the strongest argument for recording at all.
Each of those uses has different accuracy requirements, which is why the same equipment can be right for one clinic and excessive for another.
Portable recording and the conditions problem
A portable system records on whatever surface the site provides, which makes the conditions statement more important rather than less. A recording made on a hard floor and one made on carpet are not comparable, and both are legitimate.
Standardise what you can: the same surface where possible, the same settling time, the same stance instructions. Where the surface cannot be controlled, record what it was.
Portable work also means the operator is often alone, so the routine has to be simple enough to follow without help. A three-step check before each session is more likely to survive than a ten-step protocol.
Ask any supplier how the system verifies its own readings at start-up. A portable unit that only shows a green light is asking the operator to trust it, which is not a check.
That question is worth more than a specification comparison, because it decides whether the recordings from two different sites can be placed in the same file.
The question the print is answering
Before a recording, decide which question it is for. A fitting decision, a screening triage, a follow-up comparison and a production brief all want different recordings, and a single print rarely serves all four.
For a fitting decision, the useful question is where load concentrates under standing. For a production brief, it is where the device needs contour and where it needs offloading. For a follow-up, it is whether anything changed since the last recording.
Writing the question first changes what the practitioner notices on the screen. A print read without a question invites a general impression, and general impressions are what reports should avoid.
It also changes the conditions. A follow-up wants the same conditions as the baseline; a first assessment wants the conditions that best represent the client’s day.
Two minutes of planning before the capture saves an hour of ambiguity afterwards.
Teaching clients to read their own print
A client who understands the image will accept the recommendation more readily, and will notice when a later recording looks different. That makes them a partner rather than a recipient.
Explain three things: colour means amount, outline means contact, and the picture is a snapshot of one moment. Those three sentences cover most of what a non-specialist needs.
Then explain what the print does not say: it does not say whether the pattern is a problem, and it does not predict how anything will feel. Clients accept that limitation more easily than practitioners expect.
Where a client asks whether their print is normal, answer honestly: there is a range, and the useful comparison is with their own previous recordings rather than with other people.
That answer is also a reason to record at every visit, which is the habit that makes the equipment worth owning.
Why the same foot can print differently twice
Stance is the largest source of variation. A client who stands with weight slightly forward produces a different distribution from one who stands back, and neither is wrong.
Time is the second. A print taken ten seconds after standing shows a settling foot; one taken a minute later shows the final position. Consistency matters more than duration.
Footwear history is the third. A client who has worn a particular shoe all day arrives with soft tissue already shaped by it, and the print reflects that.
Temperature and fatigue are smaller effects that nevertheless appear in comparisons across a long day. Recording at a similar time of day makes visits more comparable.
Knowing these sources is what stops a practitioner from interpreting ordinary variation as a change in the client.
Frequently asked questions
What does a footprint pressure measurement show?
It shows how load was distributed between the sole and a surface at the moment of capture, in the conditions recorded. It does not establish cause or predict an outcome.
Is a static print enough for a clinical decision?
It describes standing distribution only. Questions about walking need a dynamic recording, and a static print should not be used to reason about gait.
Why do two prints of the same client look different?
Contact area and values change with stance, surface, footwear and settling time. Standardising those conditions is what makes comparison meaningful.
What is a peak value in real terms?
It is the highest value in the field at one location, derived from the force carried by the sensing element. Position and the shape around it matter more than the number alone.
Can a portable system record a usable print?
Yes, if the surface and the setup are recorded along with the data. Portable work makes the conditions statement more important, not less.
Do your systems report values in standard units?
The software reports the measurements it records, and the export includes the conditions of the session. Ask for a demonstration on your own data to see the format.
What support comes with a unit?
Twelve months on non-human damage with free replacement parts, a dedicated WhatsApp group, direct access to our engineers, remote assistance where the site allows it, and over-the-air updates for connected units.
What we would do next
Take one static print and write three sentences about it: one describing the values, one describing an observation, one describing what it does not show. If the third sentence is difficult, the report is overstating. The product overview covers the X1 and the rest of the range, the FAQ page answers commercial questions, and our article on reading a plantar pressure map goes deeper into the values.
This article is intended for professional and educational reference. It is not medical advice. Foot assessment equipment produces measurements and images; clinical interpretation and any decision about care remain the responsibility of a qualified professional. Certification scope is limited to the documentation we hold: European Union certification and ISO quality system certification.