
A foot pressure map is the most persuasive image in the industry and the most over-read. Clients see colours and see a verdict; buyers see colours and see a selling tool; professionals see colours and — if they are careful — see a distribution of force that needs three more layers of context before it says anything at all.
The gap between the image and its meaning is where good systems earn their keep and where bad habits form. Reading a map well is a craft with rules: zones before colours, timing before peaks, the client in front of the screen before the client on the screen.
This article teaches the reading the way we teach it to operators: what the zones are, what timing adds, how the alignment layer completes the picture, and which misreadings to design your workflow against. We build the mapping systems, so the description of what the colours are — and are not — comes from the sensor layer up.
What the map actually is
A pressure map is a distribution: how the total force between foot and ground spreads across the sole at a moment, sampled across the sensor layer beneath it. Colour is the display convention — warmer where force concentrates, cooler where it does not — and the convention is chosen for instant readability, which is both the map’s power and its hazard.
The map is honest about force and silent about everything else. It does not know why load concentrates: structure, habit, footwear, fatigue, pain behaviour, or simply the way this person chose to stand for three seconds. All of those produce colours, and the map displays them identically.
It is also a moment, or a sequence of moments, not a personality. The same foot produces different maps across days, speeds, shoes and states of tiredness. A single map is a data point with feet; a series of maps under a locked protocol is a record.
So the first reading rule: read the map as a measurement of distribution, taken in stated conditions, describing this foot on this day. Everything else — the interpretation, the conversation, the plan — is layered on by a professional, and the layering is where the value lives.
Zones before colours
Read the map by regions, not by impressions: heel, midfoot or arch region, forefoot, toes. For each zone, the useful questions are share and shape — how much of the total load passes through it, and how that load is spread or concentrated inside the zone. A heel carrying a typical share with a tight hot core is a different observation from a heel carrying an unusual share evenly.
The medial-lateral dimension matters as much as the front-back one: how load divides between the inner and outer columns of the foot is the observation most clients and most misreadings fixate on, and it is the one most sensitive to stance width and habit. A map taken in a comfortable stance and one taken in an adjusted stance can differ markedly — which is information, if the conditions are recorded, and noise if they are not.
Compare zones against each other rather than against an ideal: the map describes a distribution, and distributions are read relationally — this forefoot against this heel, this foot against that one. The ideal-shaped foot exists mostly in marketing; the map in front of you describes a person.
And read the zones’ boundaries: where the arch region contact ends, where the forefoot load gathers toward which rays. Boundaries carry more usable information than the hot spot everyone looks at first.
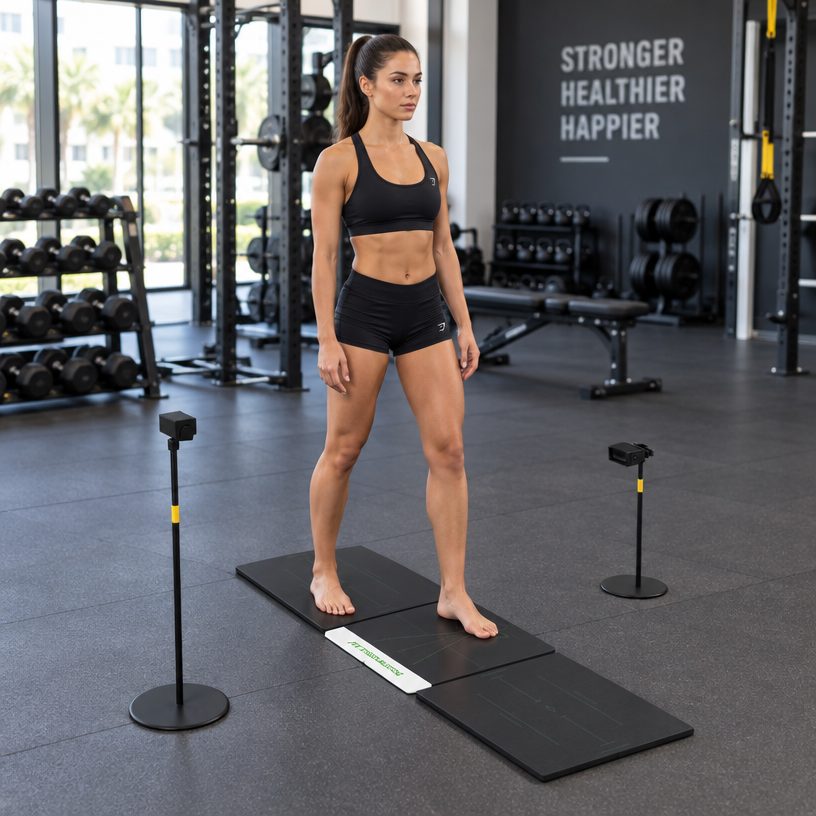
A zone-reading refinement worth teaching early: the second-by-second within stance. Even a static capture holds a few seconds, and load redistributes across them as the client settles — the first second is arrival, the last is balance. Systems that show the sequence rather than the average give the professional a small but real depth: a concentration that vanishes on settling is posture; one that deepens is structure. Ask whether your system shows the settling sequence or only the averaged frame — the answer is a quiet differentiator between products in the same category.
Timing: the layer static maps cannot show
A single standing map is a snapshot; gait is a film. In walking, load arrives at the heel, transfers through the midfoot, gathers at the forefoot and leaves through the toes — and the timing of that sequence, phase by phase, is where the professional reading earns its depth.
Two maps with identical colours can sit on opposite ends of timing: one foot passes through its peak quickly, another dwells. The dweller and the sprinter have different conversations ahead of them, and no static image can tell them apart. This is why dynamic capture exists, and why a room that serves movement eventually adds it.
Timing also exposes asymmetry cleanly: the two feet in the same walk, compared phase by phase, in the same document. The eye compensates for asymmetry remarkably well; the record does not, and that refusal is its value.
When the workflow is standing-only, the honest position is to say so: the map describes stance, and stance is a shorter story than the day. Rooms that promise motion from a static map are borrowing against a record they do not have.
The alignment layer: context the colours lack
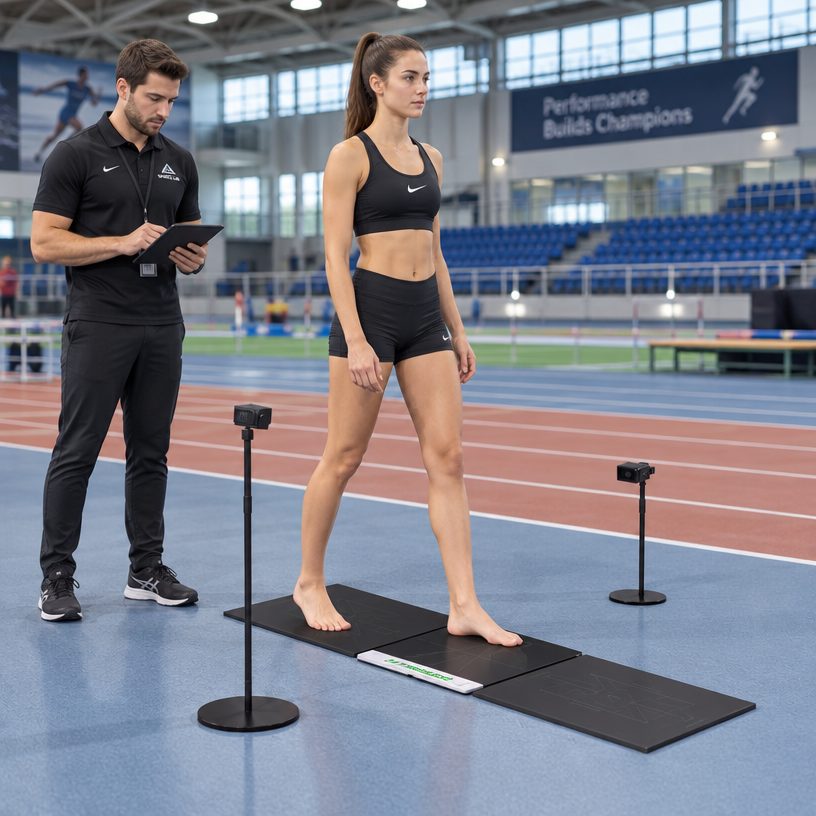
Pressure says how much and where; the camera layer says how the foot and leg are arranged while it happens. Heel position relative to the leg, the general alignment of foot and ankle in stance, the posture views from the standardised angles — these turn a distribution into a picture of a person standing, not just of forces arriving.
The two layers keep each other honest. A concentration that looks alarming in colours may sit inside an unremarkable alignment; a striking alignment may load the map gently. Either observation, alone, invites over-reading; together they invite the professional’s judgement, which is the proper destination.
Alignment views are also the layer clients understand fastest. A person sees their own stance in a posture image before they parse a pressure legend, and the explanation that starts from what they can see lands in half the time. The map persuades professionals; the alignment view persuades everyone else.
Capture the layers in the same session, under the same conditions, in the same record — as our systems do — so the professional reads one document rather than reconciling two.
The alignment layer has one reading discipline of its own: standard angles, stated. Posture views are only comparable when the camera positions are comparable, which is why the capture protocol locks them — distance, height, angle — and why the report should say which views were used. A posture image without its angle is a portrait, not a measurement. Rooms that inherit a protocol from a previous operator should re-verify the angles once with a tape measure; the exercise takes ten minutes and restores the comparability that makes the layer worth having.
The four misreadings to design against
First: the verdict misreading — colours read as a condition. The map shows distribution; naming belongs to the professional with the history and the examination. Design the report and the script so the boundary is visible to the client, not just known to the operator.
Second: the snapshot misreading — one map taken as the foot’s truth. Feet vary by day, shoe and fatigue. The protocol — locked conditions, repeated passes, recorded context — is what makes the second map comparable to the first, and comparability is the whole game.
Third: the hotspot misreading — the bright spot read as the whole story. Hotspots are where force concentrated in those seconds; they are entry points for questions, not conclusions. The zones, the timing and the alignment layers exist precisely to give the hotspot its context.
Fourth: the symmetry misreading — expecting the two feet to mirror. Most pairs differ, and most differences are ordinary. Asymmetry is an observation to record and, where relevant, to follow across visits — not an alarm to announce at first capture.
The verdict misreading has a commercial dimension worth naming for buyers: it is tempting, in a sales environment, to let the client’s own over-reading do the selling — the colours say so much. The temptation should be declined, and not only for ethical reasons that this article has already covered: the client who was frightened by a map tells the story at dinner, and the story that spreads is the room’s reputation for frightening people. The room known for explaining is the one the professionals refer to. Fear converts once; explanation converts for years.
Reading for the client in the room
The map’s second audience is the client, and the reading they receive shapes what they believe the equipment is for. Start from what they can see: their stance in the alignment view, then their distribution in the map, then — only then — what the professional makes of the two together.
Use the record’s own conditions in the explanation: today, in this stance, in these shoes. The sentence does double duty — it makes the reading precise and it teaches the client why the follow-up matters and why the conditions will be repeated.
Resist the dramatic reading. The map that is used to frighten sells once; the map that is used to explain returns for the comparison visit. The comparison visit is where the equipment’s value actually lives, and it is only booked by clients who felt informed rather than processed.
And give the client something to take: the printed or exported record, conditions attached. A record that leaves the room keeps working — at the referral, at the next visit, in the client’s own understanding of what was measured and why.
On the fourth misreading, symmetry, one practical script helps: when the client asks why the two sides differ, the answer that serves is a sentence plus a plan — most feet differ a little; we will look at it again next time under the same conditions and see whether it holds. The sentence is true, calm and checkable, and the plan converts the anxiety into an appointment. Operators who improvise longer answers than that drift toward interpretation, which is the professional’s lane. The script is not evasion; it is the boundary made speakable.
The craft, summarised
Zones before colours: share and shape, medial against lateral, boundaries before hotspots. Timing when the workflow has it, honestly described when it has not. Alignment beside pressure, captured in the same session. Conditions recorded with everything, so the next map can be compared rather than admired.
Misreadings designed against: verdict, snapshot, hotspot, symmetry. Each has a procedural answer — the boundary script, the locked protocol, the context layers, the neutral comparison vocabulary — and the procedures cost less than any of the disputes they prevent.
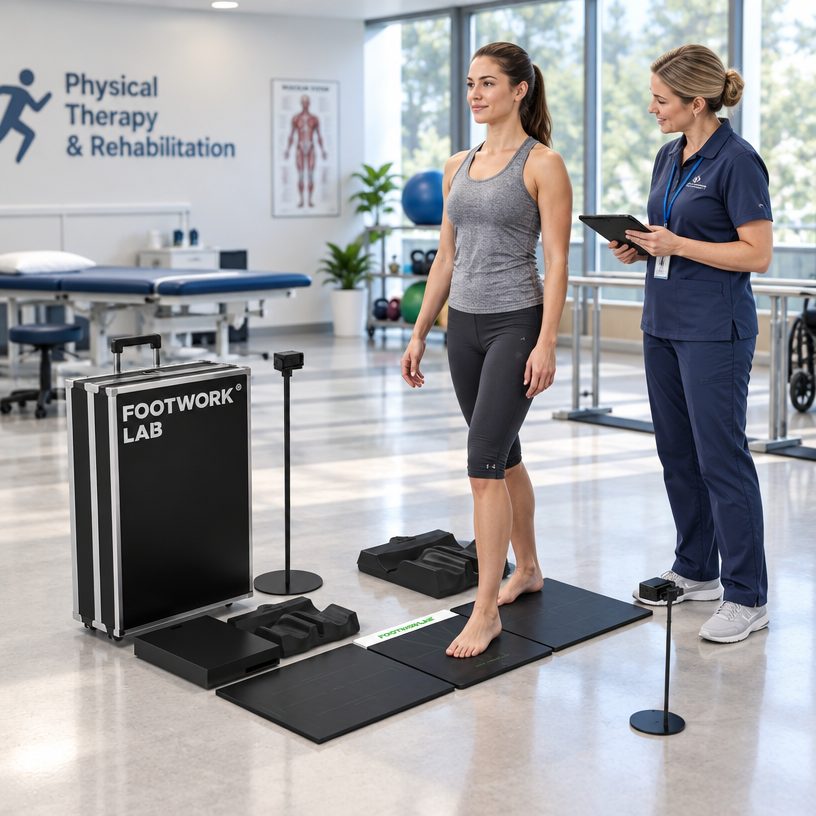
The professional does the interpreting; the map does the measuring; the client leaves with a document that says what was measured, in what conditions, and why the next one will be taken the same way. That loop — measure, read, compare — is what pressure mapping is actually for, and everything outside it is decoration.
Read that way, the most persuasive image in the industry becomes one of the most trustworthy: not because it says less, but because everyone in the room knows exactly what it is saying.
And a closing note on who should own the reading craft in a room: everyone who touches the capture, including the front desk. The person who books the appointment and takes the shoes sets the conditions; the person who runs the capture sets the passes; the person who prints the report handles the document. Reading the map well is the professional’s craft, but preparing the map well is a team sport, and the rooms that run it that way — protocol known at every station, conditions recorded at every step — produce the records that professionals thank them for.
Frequently asked questions
What do the colours on a pressure map mean?
Colour is a display convention for force distribution: warmer where the load concentrates, cooler where it does not. The map records how force spreads across the sole in the conditions captured — it does not name causes or conditions; interpretation belongs to the professional.
Why does the same foot produce different maps on different days?
Distribution shifts with stance, footwear, fatigue and speed. That is why records are taken under a locked protocol — same conditions, repeated passes, context recorded — so two maps can be compared meaningfully rather than admired separately.
Does a static pressure map show how I walk?
No. It shows how load distributes in the position captured. Walking records — how load moves phase by phase — come from dynamic capture, which is a different workflow. Rooms should state which one they took.
Why capture posture images alongside the pressure map?
The camera layer records how the foot and leg are arranged while the load happens — context the pressure data lacks. The two layers together give the professional the full first document, captured under the same conditions.
Can two feet in the same person produce different maps?
Usually yes, and most differences are ordinary. Asymmetry is an observation to record and follow across visits, not an alarm to announce — the comparison over time is what gives it meaning.
Can the record be used to order custom insoles?
Yes. The record plus context notes — shoe, activity, hours — becomes the specification a made-to-measure pair is designed from. Samples ship within three days, and production minimums start at two hundred pairs mixed across models and sizes.
What does your equipment claim — and not claim?
Our systems are plantar pressure measurement systems: pressure sensing, camera-based posture and alignment capture, analysis software. They produce measurements and images. Clinical interpretation belongs to the qualified professional — a boundary we state in writing with every sale.
What we would do next
Write your room’s reading protocol this week — zones, conditions, the boundary script for clients — and the maps will start agreeing with each other. The system that carries the protocol: F2 / FMP Gait Scanner.
For the report layer — what belongs in a foot analysis document and what should stay out — our dedicated guide completes the picture.
This article is intended for professional and educational reference. It is not medical advice. Foot assessment equipment produces measurements and images; clinical interpretation and any decision about care remain the responsibility of a qualified professional. Certification scope is limited to the documentation we hold: European Union certification and ISO quality system certification.