
A gait report looks like a verdict and is not one. A 3D gait
analysis scanner returns curves, colour maps and numeric tables, and the natural instinct of anyone
new to the equipment is to read them as a conclusion about a person. What the report actually holds
is a record of measurements collected while someone walks or runs: when the foot meets the ground,
how load is distributed beneath it, where the body’s weight travels, and how the two sides compare.
Everything beyond that — what those numbers mean for this individual and what should follow — is
interpretation, and interpretation stays with a qualified professional.
The distinction is the most useful thing to grasp about this equipment, whether you are a clinic
choosing a platform or a distributor explaining one to a customer. A single body of data supports
two very different conversations: one about what was measured and how repeatably, and another about
what it signifies. A measurement platform is built for the first. This article walks through what a
report from a 3D gait analysis scanner actually contains, section by section, and marks the point
where measurement stops.
Measurement and diagnosis are two different jobs
The phrase “gait analysis” is broad, and it helps to separate the part a machine performs from
the part a person performs. What the platform contributes is capture: it records data while the
subject moves and organises that data into a repeatable, comparable form. What it does not produce
is a conclusion.
A report describes. It can state that contact timing on the left differed from the right within a
given trial, that pressure concentrated under one region of the foot, that the centre of pressure
followed one path rather than another. Each of those is a description of a measurement. Turning a
description into a statement about a person’s condition, and then into a decision about what to do,
requires a clinician, a history and usually more than one source of information.
This is why we describe the F5LAB platform and the rest of our range as assessment equipment
rather than diagnostic instruments. The machine produces measurements and images; the interpretation
and any decision about care remain the responsibility of a qualified professional. Any listing that
implies the hardware itself delivers a diagnosis is describing something the hardware does not do.
That matters commercially as much as clinically: a buyer who expects a diagnostic device and
receives a measurement platform will feel let down by equipment that is working exactly as
designed.
Where the platform earns its place is consistency. A protocol run the same way on every visit
removes a great deal of variation, so a change seen at follow-up is more likely to reflect the
person and less likely to reflect the way the measurement was taken.
That has a practical consequence at the specification stage. If a team assumes the software will
tell them what is going on, they will spend their budget on report features and on-screen
advisories, and will undervalue the things that actually decide whether the platform gets used: how
quickly a protocol runs, how steady the capture is between operators, and how easily a curve can be
compared with a previous visit. We would rather a buyer weigh those three than chase an automated
verdict that no measurement device can honestly provide.
The gait cycle: stance, swing and the phases between
The gait cycle is the unit most reports are built around. It begins when one foot contacts the
ground and ends when the same foot contacts the ground again. Within that loop, the two states
everyone should recognise are stance — the period the foot is in contact with the ground — and
swing, the period it travels forward through the air. In ordinary walking, stance occupies the
larger share of the cycle and swing the smaller; running shifts that balance and adds a flight phase
in which neither foot is down.
Different platforms divide the cycle differently, and the names vary between schools and between
software builds. What matters when reading a report is not the exact label but whether the dividing
lines are stated, so a curve can be read against a defined moment rather than a guess. A well-built
report labels its events; a weaker one leaves the reader matching colours from memory.
- Contact and loading — the moment the foot meets the surface and the short period
after, when the limb begins to accept weight. - Midstance — the foot is flat and the body’s mass passes over it.
- Terminal stance to pre-swing — the heel begins to lift and the foot prepares to
leave the ground. - Swing — the limb travels forward, and clearance and timing become the
interesting variables.
Reading the cycle this way turns a wall of colour into a sequence. Instead of asking “is this
normal”, the reader asks “at which moment does this differ” — a more useful question, and one the
data can actually answer.
One caution applies to the whole cycle: the shape moves with speed. A person walking faster or
slower than in a previous session will produce a different cycle, not because anything changed about
them but because the task changed. This is why a consistent protocol — the same walkway or platform,
the same instructions, roughly the same pace — matters more than the sophistication of the display.
Without that consistency, a report is a set of unrelated pictures rather than a series.
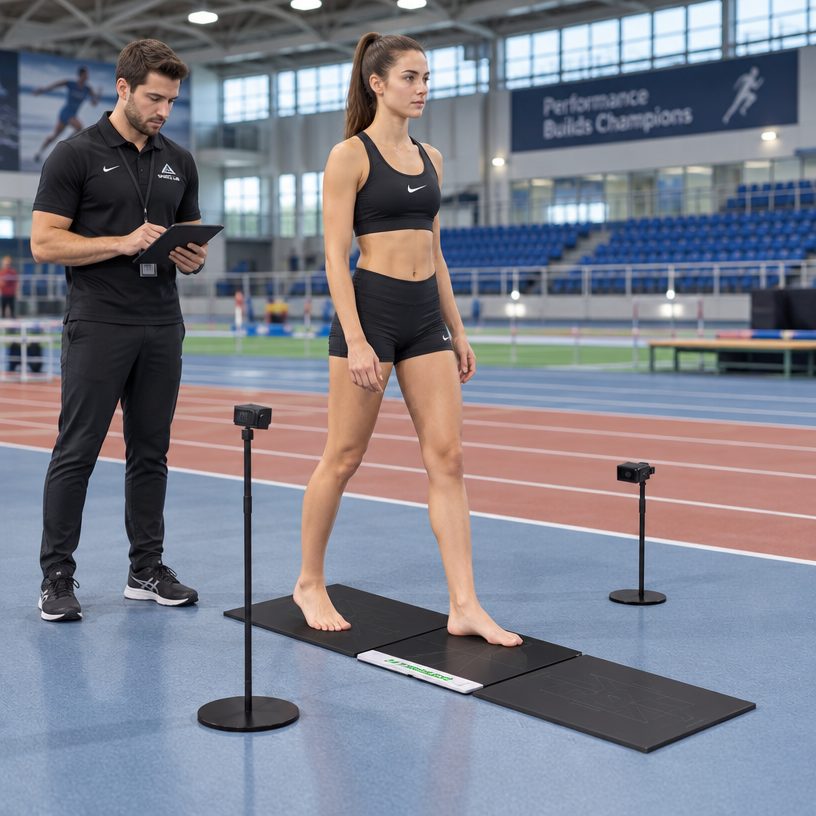
Plantar pressure and how load is distributed under the foot
Beneath the timing sits load. Plantar pressure measurement records how the force between foot and
surface is spread across the sole: which regions carry more, which carry less, and how that
distribution shifts from step to step. Presented as a colour map, it is the most immediately
readable part of any report — and also the easiest to over-read.
Two maps that look alike can come from very different situations, and two maps that look
different may simply reflect how the person placed the foot on the plate. The colour scale should be
read together with the platform the data came from and with the person’s position at the moment of
capture. A region that shows high load in one trial is not, by itself, a finding; it is a reason to
look again.
The static-versus-dynamic question is worth holding onto. A standing record shows how load sits
when the body is still — useful as a baseline, and quick to capture. A dynamic record, taken during
walking or running, shows how that load behaves while the foot is actually being used. They are not
substitutes. A person whose standing map looks even can still show a markedly different pattern in
motion, and the reverse is equally true.
At the level of a single print, the report lets a clinician point to a named region and ask a
question rather than merely look at a picture. That is the value of the pressure layer: it converts
“the foot” into defined areas that can be compared across visits.
It helps to decide in advance which regions a team will track. Loading under the rearfoot, the
midfoot, the forefoot and each half of the foot can each be followed over time, and a small number
of well-chosen reference areas produces a more useful series than a dense map nobody revisits. The
map is the raw material; the naming and the tracking are what turn it into something a clinic can
actually work with.
Centre of pressure and the path of a step
Centre of pressure (COP) is the point on the foot through which the total reaction force would
act at any given moment — a single moving coordinate that summarises where the load is centred.
Tracked across a step, it traces a path: typically starting near the heel, crossing the midfoot and
finishing under the forefoot as the foot leaves the ground.
The shape of that path is one of the more informative signals a report contains. Where it starts,
how directly or gradually it crosses the foot, whether it deviates far to one side, and whether the
two feet produce similar paths are all visible. Because it is a trajectory rather than a still
picture, it responds well to comparison between visits.
Force-line alignment belongs in the same conversation. Where a platform records leg and ankle
position alongside the pressure beneath the foot, the COP path can be read against the line the
limb is following, which supplies context that pressure data alone does not carry. A path that looks
unusual in isolation may make sense once the alignment record sits beside it.
What the path does not provide is a reason. It shows where load travelled, not why the body chose
that route, and not what the person felt at the time. That gap between a trajectory and an
explanation is the gap a clinician fills.
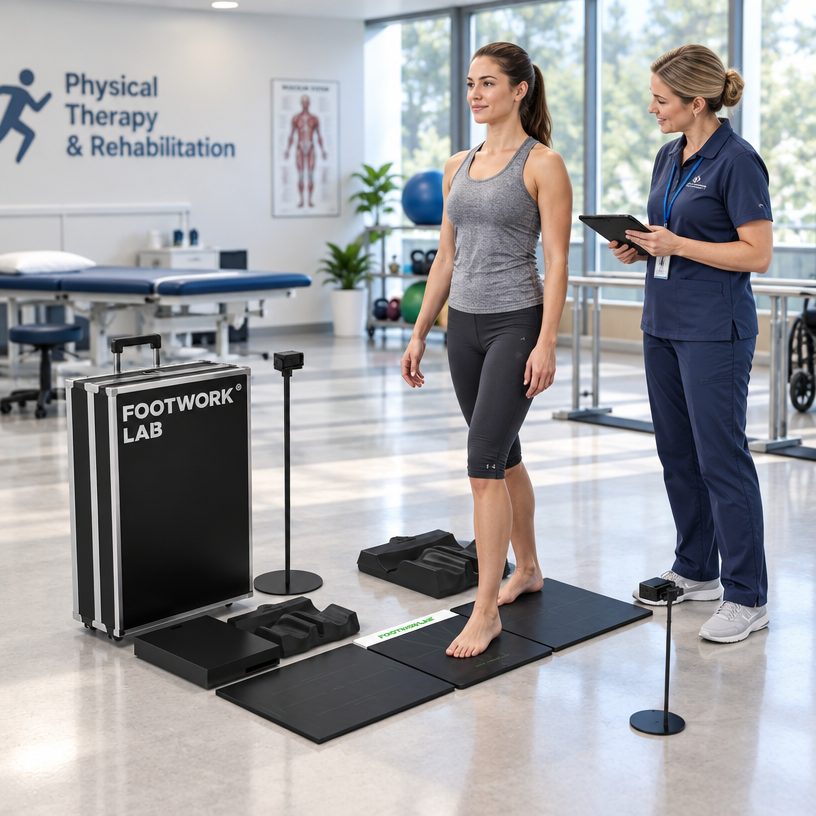
Symmetry between the left and right side
Because the two feet can be compared directly, left-to-right symmetry is among the most-used
comparisons in a report — and among the most misunderstood. The platform can show how contact
timing, load distribution and COP paths differ between sides. Some difference is entirely ordinary;
people have a preferred side, and no two feet behave identically.
What the comparison provides is a starting point framed in a way the report can support: does a
difference persist across trials, is it present in both standing and moving records, does it change
between visits. A single asymmetric reading is rarely decisive; a consistent pattern is more
interesting.
It is also worth remembering that symmetry is a comparison, not a standard. Two sides that differ
are not automatically a problem, and two sides that match are not automatically fine — a pattern can
be symmetrical and still worth a second look, just as it can be asymmetric and entirely
unremarkable. The platform reports the comparison; what the comparison means is a separate question
that the report does not settle.
Symmetry is also where users are most tempted to over-reach. A report can state that one side
bore more load than the other during a given walk. It cannot state what that means for the person,
whether it matters, or what should be done about it. Those are judgements, and they belong to the
professional working from a full picture, not to the software.
We build the platform to deliver clean, repeatable input to that professional. A tidy curve is
the deliverable; the reading of the curve is somebody else’s work, and that division is deliberate.
What the report cannot do
It is worth being explicit about the boundary, because the boundary is why the equipment is sold
as a measuring tool. A report from a gait platform cannot:
- Name a condition. It records how load, timing and position behaved; it does not
assign a cause or a label. - Explain a reported symptom. What a person says about their experience is
history, and history comes from the person, not from the walkway. - Describe soft tissue. Tendon behaviour, muscle activity and joint mobility are
not what pressure and position sensing is built to capture. - Decide what should follow. Selection of any next step is a professional
decision.
The static-versus-dynamic choice runs through all of this. A still record and a moving record
answer different questions, and neither is a substitute for the other or for a full professional
assessment.
None of those limits makes the record less useful; it makes the record more honest. A clinician
who knows exactly what a curve describes will use it well, while one who assumes it describes more
will eventually be caught out in front of a patient. Being clear about the boundary protects both
the buyer and the person being measured.
On our side, the practical commitments concern the instrument holding up rather than any promised
outcome. Every unit runs through a seven-day test cycle before dispatch. The machines use a modular
design so parts can be replaced individually rather than as whole assemblies. The software includes
remote-control functionality, so an engineer can help from a photograph, a video or, with consent, a
remote session; and where a machine is connected to the internet, updates can be pushed over the
air. Each customer has an after-sales group with our engineer in it. None of that makes a device
diagnostic — it simply keeps the measurement platform measuring.
Frequently asked questions
What does a 3D gait analysis scanner actually measure?
It records how a person moves: the timing of contact between foot and ground, the distribution of
plantar pressure under the foot, the path of the centre of pressure through a step, and, where the
platform supports it, the alignment record of the lower limb — in either a standing position or
during walking and running. The output is a set of measurements and images, organised so that
sessions can be compared.
Can the report tell me what condition someone has?
No. A report describes measurements; it does not assign a cause or a label. Interpretation of the
data, and any decision about care, is the responsibility of a qualified professional. We describe
our platforms as assessment equipment for exactly this reason.
What is the difference between static and dynamic records?
A static record is captured while the person stands still and shows how load sits when the body is
at rest. A dynamic record is captured during walking or running and shows how that load behaves in
motion. They answer different questions and are not interchangeable.
What is centre of pressure, in plain terms?
It is the point on the foot through which the total reaction force would act at a moment in time.
Tracked across a step, it traces a path from the heel toward the forefoot. That path is a
description of where load travelled, not an explanation of why.
Can the analysis software or the report format be customised?
Yes. Because we develop the software ourselves, custom report fields and interface changes are
possible. These are quoted separately, because the scope varies substantially between projects.
How is the equipment tested and supported after delivery?
Every unit runs through a seven-day test period before dispatch. The machine carries a
twelve-month warranty covering non-human-caused failures. The modular design and remote-control
functionality mean many issues can be worked through from photographs, video or a remote session
with consent, and each customer has an after-sales group with our engineer in it.
Is the equipment a diagnostic device?
No. It produces measurements and images. Clinical interpretation and any decision about care
remain the responsibility of a qualified professional.
What we would do next
If you are specifying a gait platform, start by deciding which measurements your team will
actually act on — timing, plantar pressure, centre of pressure, alignment, or a combination — and
which you will never look at twice. That list, more than any specification sheet, tells you what to
buy and what to leave out.
Our own workflow points are on the F5LAB gait and
running platform page, and we have written separately about reading
plantar pressure and gait data and about what gait analysis can and cannot
tell you. If you tell us your setting and the questions your team asks most often, we will say
which configuration fits and, just as usefully, which parts of our range you do not need. The
FAQ covers commercial and service terms in detail, and the
contact page reaches our team directly.
This article is intended for professional and educational reference. It is
not medical advice. Foot assessment equipment produces measurements and images; clinical
interpretation and any decision about care remain the responsibility of a qualified professional.
Certification scope is limited to the documentation we hold: European Union certification and ISO
quality system certification.